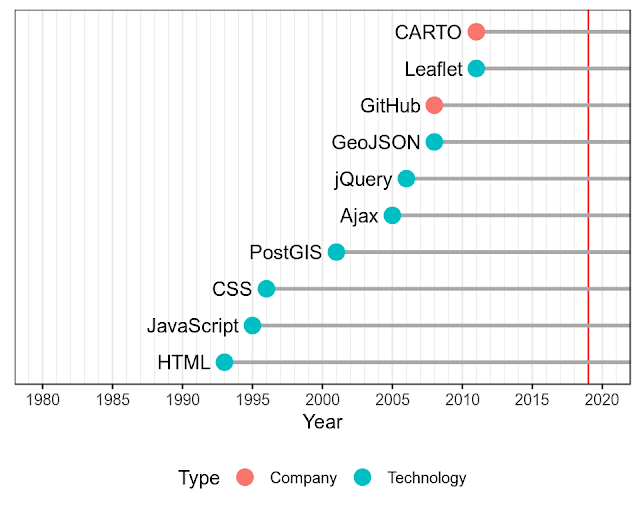
Great to see this online free book from Michael Dorman: Introduction to web mapping
Download in PDF
INDEX:
Introduction
- 0.1 What is web mapping?
- 0.2 What is JavaScript?
- 0.3 Why use JavaScript for web mapping?
- 0.4 Learning objectives
- 0.5 Software
- 0.6 Background knowledge
- 0.7 Online version
- 0.8 Acknowledgments
I Introduction to Web Technologies
- 1 HTML
- 1.1 How do people access the web?
- 1.1.1 Browsers
- 1.1.2 Web servers
- 1.2 Web pages
- 1.3 Text editors
- 1.4 What is HTML?
- 1.4.1 Overview
- 1.4.2 HTML comments
- 1.4.3 Block vs. Inline
- 1.5 Common HTML elements
- 1.5.1 Structure
- 1.5.2 Title and metadata
- 1.5.3 Styling and Scripts
- 1.5.4 Headings and paragraphs
- 1.5.5 Font formatting
- 1.5.6 Spacing
- 1.5.7 Lists
- 1.5.8 Links
- 1.5.9 Images
- 1.5.10 Tables
- 1.5.11 Grouping
- 1.5.12 Input elements
- 1.6 id, class and style attributes
- 1.6.1 id
- 1.6.2 class
- 1.6.3 style
- 1.7 Code layout
- 1.8 Inspecting elements
- 1.9 Exercise
2 CSS
- 2.1 What is CSS?
- 2.2 CSS rules
- 2.3 CSS selectors
- 2.3.1 Type selector
- 2.3.2 Class selector
- 2.3.3 ID selector
- 2.3.4 Descendant selector
- 2.4 CSS conflicts
- 2.5 CSS inheritance
- 2.6 Linking CSS to HTML
- 2.6.1 Inline CSS
- 2.6.2 Embedded CSS
- 2.6.3 External CSS
- 2.7 CSS properties
- 2.7.1 Color
- 2.7.2 Text
- 2.7.3 Boxes
- 2.8 Example: Hurricane scale
- 2.9 Example: Map Description
- 2.10 Exercise
3 JavaScript Basics
- 3.1 What is JavaScript?
- 3.2 Client-side vs. server-side
- 3.3 JavaScript console
- 3.4 Assignment
- 3.5 Data types
- 3.5.1 Primitive data types
- 3.5.2 Objects
- 3.5.3 Checking type of variables
- 3.6 Functions
- 3.7 Methods
- 3.7.1 Array methods
- 3.8 Scope
- 3.9 Flow control
- 3.9.1 Conditionals
- 3.9.2 Loops
- 3.10 JavaScript Object Notation (JSON)
- 3.10.1 JSON
- 3.10.2 GeoJSON
- 3.11 Exercise
4 JavaScript Interactivity
- 4.1 The Document Object Model (DOM)
- 4.2 Accessing and modifying elements
- 4.2.1 Accessing elements
- 4.2.2 Modifying elements
- 4.2.3 Event Listeners
- 4.2.4 Hello example
- 4.2.5 Poles example
- 4.3 jQuery
- 4.4 Including the jQuery library
- 4.4.1 Including a library
- 4.4.2 Loading a local script
- 4.4.3 Loading a remote script
- 4.5 Selecting elements
- 4.6 Operating on selection
- 4.6.1 .html()
- 4.6.2 .text()
- 4.6.3 .append()
- 4.6.4 .prepend()
- 4.6.5 .attr()
- 4.6.6 .val()
- 4.7 Adding event listeners
- 4.8 Hello example
- 4.9 Poles example
- 4.10 The event object
- 4.11 Iteration over objects
- 4.12 Modifying page based on data
- 4.13 Working with user input
- 4.14 Exercise
5 Web Servers
- 5.1 Introduction
- 5.2 Web servers
- 5.3 Communicating through HTTP
- 5.3.1 Web protocols and HTTP
- 5.3.2 HTTP methods
- 5.4 Static vs. dynamic servers
- 5.4.1 Overview
- 5.4.2 Static servers
- 5.4.3 Dynamic servers
- 5.4.4 Software
- 5.4.5 Practical considerations
- 5.5 URLs and file structure
- 5.5.1 URLs and index.html
- 5.5.2 File structure
- 5.5.3 Relative paths
- 5.5.4 CSS and JavaScript
- 5.6 Running a static server
- 5.6.1 Local with Python
- 5.6.2 Remote with GitHub Pages
- II Web Mapping with Leaflet
6 Leaflet
- 6.1 Introduction
- 6.2 What is a web map?
- 6.3 What is Leaflet?
- 6.4 Alternatives to Leaflet
- 6.5 Creating a basic web map
- 6.5.1 Web page setup
- 6.5.2 Including Leaflet CSS & JS
- 6.5.3 Adding map
- 6.5.4 Creating a map object
- 6.5.5 What are tile layers?
- 6.5.6 Adding a tile layer
- 6.5.7 Tile layer providers
- 6.6 Adding vector layers
- 6.6.1 Adding markers
- 6.6.2 Adding lines
- 6.6.3 Adding polygons
- 6.6.4 Other vector layer types
- 6.7 Adding popups
- 6.8 Adding a description
- 6.9 Introducing map events
- 6.10 Exercise
7 GeoJSON
- 7.1 What is GeoJSON?
- 7.2 GeoJSON structure
- 7.2.1 Overview
- 7.2.2 Geometries
- 7.2.3 Features
- 7.2.4 Feature collections
- 7.3 Editing GeoJSON
- 7.3.1 geojson.io
- 7.3.2 mapshaper
- 7.3.3 Formatting JSON
- 7.4 Adding GeoJSON to Leaflet map
- 7.5 GeoJSON viewer
- 7.5.1 HTML and CSS
- 7.5.2 Base map
- 7.5.3 Adding an event listener
- 7.5.4 Using layer groups
- 7.6 Ajax
- 7.6.1 Overview
- 7.6.2 Examples
- 7.6.3 Ajax requests with jQuery
- 7.7 The $.getJSON function
- 7.7.1 Overview
- 7.7.2 Loading local files
- 7.7.3 Loading remote files
- 7.8 Exercise
8 Symbology and Interactivity
- 8.1 Introduction
- 8.2 L.geoJSON options
- 8.3 Constant style
- 8.4 Varying style
- 8.4.1 States example
- 8.4.2 Towns example
- 8.5 Constructing popups from data
- 8.6 Adding a legend
- 8.6.1 Using L.control
- 8.7 Using CSS to style the legend
- 8.8 Dynamic style
- 8.8.1 Styling in response to events
- 8.8.2 Dynamic control contents
- 8.8.3 Linked views
- 8.9 Exercise
III Databases
9 Databases
- 9.1 Introduction
- 9.2 What is CARTO?
- 9.2.1 The CARTO platform
- 9.2.2 Alternatives to CARTO
- 9.3 Databases
- 9.4 Spatial databases
- 9.5 What is PostGIS?
- 9.6 What is SQL?
- 9.6.1 Overview
- 9.6.2 Non-spatial queries
- 9.6.3 The geometry column
- 9.6.4 Spatial queries
- 9.7 The CARTO SQL API
- 9.7.1 API usage
- 9.7.2 Query example
- 9.7.3 Uploading your data
- 9.8 CARTO and Leaflet
- 9.9 Exercise
10 Non-spatial queries
- 10.1 Introduction
- 10.2 Subsetting with SQL
- 10.2.1 Filtering based on attributes
- 10.2.2 Displaying on a map
- 10.3 Creating a dropdown menu
- 10.4 Populating dropdown options
- 10.4.1 How many species do we have?
- 10.4.2 Dropdown menu placeholder
- 10.4.3 Finding unique values
- 10.4.4 Adding the options
- 10.5 Updating the map
- 10.5.1 Overview
- 10.5.2 Manual example
- 10.5.3 Automatic updating
- 10.6 Rearranging the code
- 10.7 Exercise
11 Spatial queries
- 11.1 Introduction
- 11.2 Adding marker on click
- 11.2.1 Getting click coordinates
- 11.2.2 Adding custom marker
- 11.3 Spatial PostGIS operators
- 11.3.1 Overview
- 11.3.2 Geographical distance
- 11.3.3 Sphere vs. Shperoid
- 11.4 Adding nearest points to map
- 11.5 Drawing line connectors
- 11.6 Exercise
IV Advanced topics
12 Client-Side Geoprocessing
- 12.1 Introduction
- 12.2 Geoprocessing with Turf.js
- 12.2.1 Overview
- 12.2.2 Including the Turf.js library
- 12.3 Great Circle line
- 12.4 Continuously updated TIN
- 12.4.1 Overview
- 12.4.2 Generating random points
- 12.4.3 Adding a TIN layer
- 12.4.4 Draggable circle markers
- 12.4.5 Continuous updating
- 12.5 Clustering
- 12.5.1 Overview
- 12.5.2 Processing sets of features
- 12.5.3 Adding a Convex Hull
- 12.5.4 DBSCAN clustering
- 12.6 Heatmaps with Leaflet.heat
- 12.7 Exercise
13 Collaborative Mapping
- 13.1 Crowdsourcing
- 13.2 The drawing control
- 13.3 Working with drawn items
- 13.4 Submission form
- 13.5 Sending features to the database
- 13.5.1 Setting database permissions
- 13.5.2 Adding draw control
- 13.6 Exercise
V Appendices
Appendix
A Associated files
B List of examples
- B.1 Main
- B.2 Additional
- B.2.1 HTML and CSS
- B.2.2 JavaScript
- B.2.3 Leaflet
- B.2.4 Geo-processing
- B.2.5 2.5D Maps
- B.2.6 3D maps
- B.2.7 Animation
- B.2.8 Real-time data
C List of exercise solutions
D General Information
D.1 Place and Time
- D.2 Course materials
- D.3 Lesson Plan
- D.4 Additional resources
- D.4.1 HTML & CSS
- D.4.2 JavaScript
- D.4.3 Web mapping
- D.4.4 PostGIS
E Projects
- E.1 Overview
- E.2 CARTO Account
- E.3 Data
- E.4 Project requirements
- E.4.1 Project 01
- E.4.2 Project 02
- E.4.3 Project 03
- E.5 Submission
- E.6 Grading
F Setting up an SQL API
- F.1 PostgreSQL and PostGIS
- F.2 Adding data
- F.3 Testing
- F.4 Adding read-only user
- F.5 Node.js
- F.6 Server
- F.7 Testing
- F.8 Setup for production


