

The improvements in this version of STDashboard are focused on user interface for panel and dashboard and also some enhancement in performance and close some old bugs. It works with Pentaho versions 5, 6 and 7
You can see it in action in this Pentaho Demo Online
About UI improvements:
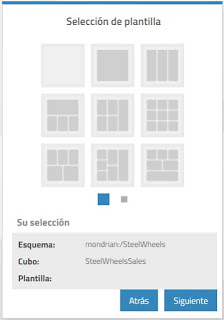
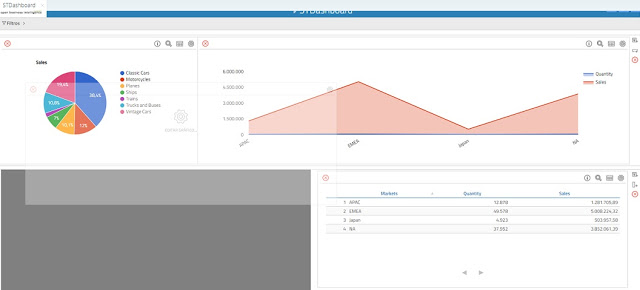
- New set of predefined dashboard templates. We have designed a new way to manage dashboard panels that allow you to shape the dashboard in almost any combination of size, proportion and amount of panel you want to have. For this reason we have created a set of different layouts for most common cases.
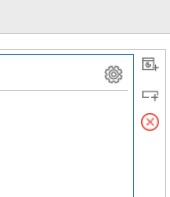
- Self managed panel. Add and remove panels, now in stdashboard you can add or remove panels easily using the button inside each panel header.
- New layout management. Now an stashboard layout is composed of a list panel container, the containers in this list are stacked vertically in the page. There are two types of such containers; horizontal and vertical, each one stores a list of real panels (the ones where the graph are drawn) in an horizontal or vertical flow, in this ways you can combine those panels to achieve almost any layout you can imagine.
- Resizable panels. We have included the possibility of resize the panel horizontally or vertically, keeping the proportion of graph inside it in correspondence with horizontal adjacent panels without making an horizontal scroll in the page, that means if you shrink a panel horizontally and there is another panel in the same row, the other panels also shrink an a proportional way to allow all panels in a row fit the horizontal size of the window.
Is interesting to note here that we have implemented this functionality using pure GWT API, to avoid external dependencies and ensure portability between browsers.
- Draggable panels. Each panel in the entire dashboard can be dragged to any parent container. In the header of each single panel the is a handle that allow dragging the panels to any panel container in the dashboard.
- Responsive Dashboard. The ability to resize dynamically the panels and graph when the window's dimensions change, or when a user make zoom in the page is now implemented, also in most phones the dashboard can be seen proportionally and keeping the original layout.
- Persistent state of the layout. When you save a dashboard to a file, we are saving the visual state of it and store it in the file. Then, when you open the dashboard, all the details of visual interface are hold and you can see the dashboard exactly the same previous to saved, that means panels size, locations are restored effectively.
About performance:
- In some points of the application an specific query was causing performance problem. To know if a member has child or not in a multilevel hierarchy, the previous code issued a query to list all the sons of that member and check if the size is greater than 0, our solutions in this case for this type of query was simply check the level of the current member and in this way answer that boolean query.
- Connection to cubes using the new MondrianOlap4jDriver java class. This improve the connection performance and stability because is designed for mondrian connections, the previous code was using an standard JDBC connection.
About new enhacements:
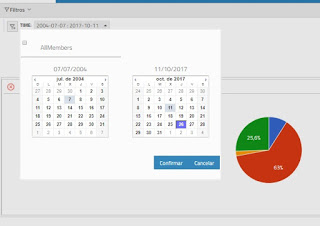
- Date configuration for filters. Date dimension are special dimensions, because almost any cube has at least one defined and are very used for make range query over fact table, to allow dynamic filter in panels, we had to enable a .property file that allow the user to define their date dimension and configure the way they want to use it in queries.
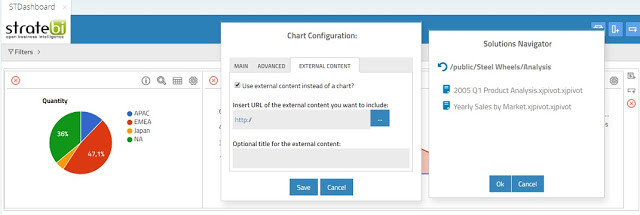
- Added the Pentaho File Explorer to allows the users navigation through the files stored in pentaho, like reports, documents, etc and embeed it inside a panel in the dashboard
See a Video Demo: